List of Brazil Ethnic Groups: The Most Populous Indigenous Peoples, Locations, and Living Conditions
Ethnic groups of Brazil with more than 10,000 Indigenous people, including population size, geographic location, and household situation.
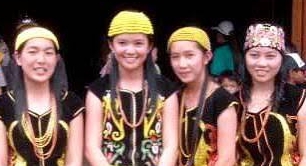
Brazil is home to one of the largest and most diverse Indigenous populations in the world. According to the IBGE Demographic Census 2022, the country recognizes hundreds of Indigenous ethnic groups, each with distinct languages, cultures, and territorial realities. This article presents a detailed list of ethnic groups of Brazil that have more than 10,000 Indigenous people, ranked in descending order of population, and highlights where these populations live and their household situations.
Understanding where Indigenous peoples live—whether in officially recognized Indigenous lands, urban areas, or rural areas outside those lands—is essential for grasping the social, political, and economic challenges they face today.
The Largest Indigenous Ethnic Groups in Brazil
The table below lists Indigenous ethnic groups with over 10,000 declared people, ordered from most to least populous. It also shows the distribution of households by location.
Indigenous Population by Ethnicity, Location, and Household Situation
Ethnicity
Total People
In Indigenous Lands
Outside Lands (Urban)
Outside Lands (Rural)
Tikuna
74,061
52,678 (71.1%)
15,724 (21.2%)
5,659 (7.6%)
Guarani
64,327
8,289 (12.9%)
43,514 (67.7%)
12,524 (19.5%)
Makuxí
53,446
36,508 (68.3%)
13,454 (25.2%)
3,484 (6.5%)
Guarani Kaiowá
50,034
35,253 (70.5%)
10,203 (20.4%)
4,578 (9.2%)
Kaingang
45,840
33,829 (73.8%)
6,898 (15.1%)
5,113 (11.2%)
Terena
44,667
21,892 (49.0%)
20,536 (46.0%)
2,239 (5.0%)
Pataxó
39,276
8,585 (21.9%)
24,694 (62.9%)
5,997 (15.3%)
Guajajara
38,244
30,701 (80.3%)
5,900 (15.4%)
1,643 (4.3%)
Potiguara
37,292
19,003 (51.0%)
10,204 (27.4%)
8,085 (21.7%)
Mura
36,347
8,171 (22.5%)
16,430 (45.2%)
11,746 (32.3%)
Baré
35,218
5,486 (15.6%)
25,343 (72.0%)
4,389 (12.5%)
Munduruku
32,896
16,450 (50.0%)
9,940 (30.2%)
6,506 (19.8%)
Sateré-Mawé
28,774
14,688 (51.1%)
11,077 (38.5%)
3,009 (10.5%)
Xavante
25,360
20,160 (79.5%)
3,456 (13.6%)
1,744 (6.9%)
Xukuru
25,321
8,320 (32.9%)
15,732 (62.1%)
1,269 (5.0%)
Apurinã
24,530
4,815 (19.6%)
15,127 (61.7%)
4,588 (18.7%)
Tupinambá
23,265
281 (1.2%)
15,602 (67.1%)
7,382 (31.7%)
Yanomami
21,975
20,732 (94.3%)
577 (2.6%)
666 (3.0%)
Pankararú
20,507
9,440 (46.0%)
8,894 (43.4%)
2,173 (10.6%)
Atikum
18,283
3,690 (20.2%)
8,883 (48.6%)
5,710 (31.2%)
Wapixana
17,331
11,090 (64.0%)
4,405 (25.4%)
1,836 (10.6%)
Kaxinawá
14,412
9,145 (63.5%)
4,332 (30.1%)
935 (6.5%)
Xacriabá
13,370
8,944 (66.9%)
3,304 (24.7%)
1,122 (8.4%)
Kayapó
11,516
9,038 (78.5%)
2,230 (19.4%)
248 (2.2%)
Tapeba
11,333
5,158 (45.5%)
5,644 (49.8%)
531 (4.7%)
Kambéba
10,316
418 (4.1%)
7,756 (75.2%)
2,142 (20.8%)
Pankará
10,160
14 (0.1%)
4,851 (47.8%)
5,295 (52.1%)
Source: IBGE – Demographic Census 2022
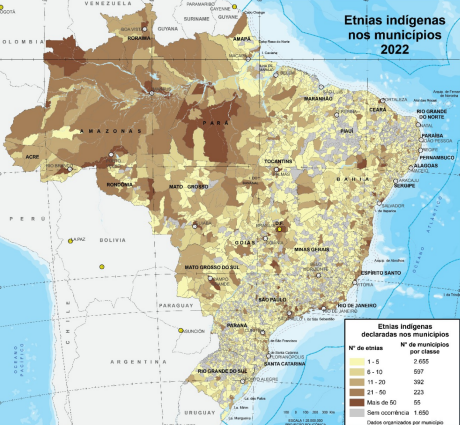
Geographic Distribution of Indigenous Peoples in Brazil
The spatial distribution of Indigenous populations varies widely. Groups like the Yanomami, Guajajara, Xavante, and Kayapó live predominantly in officially recognized Indigenous lands, mostly in the North and Center-West regions. These areas are crucial for cultural preservation but often face pressures from mining, deforestation, and land conflicts.
In contrast, groups such as the Guarani, Baré, Tupinambá, and Pataxó have a high proportion of their population living outside Indigenous lands, particularly in urban environments. This reflects historical displacement, land disputes, and migration toward cities in search of work, education, and healthcare.
Household Situation: Urbanization and Its Consequences
One of the most striking findings from the 2022 Census is the high level of urbanization among several Indigenous ethnic groups. For many peoples, living outside Indigenous lands does not mean abandoning cultural identity, but it does often mean reduced access to traditional territories and collective land rights.
Urban Indigenous households face unique challenges, including:
Limited access to culturally appropriate healthcare
Housing insecurity
Discrimination in labor markets
Loss of language transmission
At the same time, urban residence has increased Indigenous political visibility and access to education and public services.
Comparing 2010 and 2022: A Clear Demographic Shift
When compared to the 2010 Census, the 2022 data show:
Significant population growth among major ethnic groups
Increased self-identification as Indigenous
Greater dispersion outside Indigenous lands, especially in urban areas
This growth reflects both demographic factors and improved recognition of Indigenous identity in national statistics.
1. What is the largest Indigenous ethnic group in Brazil?
The Tikuna are the most populous Indigenous ethnic group, with over 74,000 people.
2. Do most Indigenous people live in Indigenous lands?
Not necessarily. Several large groups have most of their population living outside Indigenous lands, especially in urban areas.
3. Which group is most concentrated in Indigenous lands?
The Yanomami have the highest concentration, with over 94% living in Indigenous lands.
4. Why do many Indigenous people live in cities?
Urban migration is often driven by land loss, economic necessity, access to education, and healthcare.
5. Are Indigenous populations growing in Brazil?
Yes. Census data show strong growth, partly due to higher self-identification.
This list of ethnic groups of Brazil with more than 10,000 Indigenous people reveals a country marked by deep diversity and complex territorial realities. While many groups remain strongly connected to their ancestral lands, others are increasingly urbanized, reshaping what it means to be Indigenous in contemporary Brazil. Accurate data, like that from the IBGE 2022 Census, is essential for designing public policies that respect cultural diversity, territorial rights, and social inclusion.
More
List of ethnic and racial groups in Brazil 1. Official Racial Groups in Brazil Brazil officially recognizes five self-identified racial categories: Pardo (Mixed-race) – 45.3% People of mixed…
List of SNNP (Southern Nations, Nationalities and Peoples) Weredas and Zones Weredas and Zones of SNNP (Southern Nations, Nationalities and Peoples) Region, Ethiopia Gurage-Zone KebenaAbeshgeEzhaKokir GedabanoSodoMesekanMarekoEndegagnGumerChehaEnemorna EnerMuhor Na AklilGetaWelkiteButajira Hadiya-Zone MishaGibeLemoShashagoMisrak…
SNNP (Southern Nations, Nationalities and Peoples) Population according to Zone and Wereda Population of SNNP (Southern Nations, Nationalities and Peoples) Region, Ethiopia, according to Zone and Wereda SNNP Region13,044,044• Gurage-Zone1,870,368Kebena69,262Abeshge81,222Ezha117,812Kokir Gedabano126,271Sodo198,545Mesekan222,876Mareko95,509Endegagn66,159Gumer110,392Cheha166,715Enemorna Ener231,652Muhor…
List of Brazil’s most popular names Most popular names in Brazil, including meanings, cultural influence, and why these names have stood the test of time. Brazil…
List of Brazil’s Racial Groups A look at racial groups in Brazil based on the 2022 Census (IBGE), with percentages and population numbers Total population…
Standard of Living in Ogun State Poverty has been defined as the lack of income (in cash or kind) necessary to ensure access to a set…
HYPERION: The World’s Tallest Known Living Tree Nestled in the dense old-growth redwood forests of Humboldt Redwoods State Park, California, Hyperion, a towering coast redwood (Sequoia sempervirens),…

 Zones and Weredas (Towns)")
 Weredas and Zones")
 Report (1981)")


, Ethiopia")


