Where Nigerians Get Drinking Water: What World Bank Backed Survey Shows
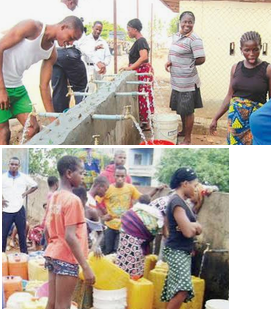
Clean drinking water is basic to health, and it matters for malaria prevention too, because water storage and the conditions around a home can affect mosquito breeding. Table 2.1 of the Nigeria Malaria Indicator Survey (MIS) 2025 shows where households get their drinking water and how long it takes to collect. It covers 20,312 households and 104,538 people. Urban and rural households are reported separately, and the gap between them is the main story.
How to read the table
The table has two parts. The first sorts every household into one of three groups by water source:
Improved sources are protected from contamination. Examples are piped water, boreholes, protected wells and springs, rainwater, tanker trucks, bottled water and sachet water.
Unimproved sources are unprotected dug wells and unprotected springs.
Surface water comes from rivers, lakes, ponds and streams.
The second part reports the round-trip time to collect water: on premises, 30 minutes or less, or more than 30 minutes.
Each column adds up to 100%. Households and population figures are both shown, and they differ by only a point or two, so the picture is the same either way.
The headline: four in five households use an improved source
Overall, 81.4% of households use an improved source (79.0% of the population). About 12.6% rely on unimproved sources and 5.9% on surface water. The national average hides a large difference between town and country:
Urban
Rural
Improved source
95.8%
65.6%
Unimproved source
2.9%
23.4%
Surface water
1.4%
11.0%
Almost every urban household has an improved source. In rural areas about one household in three does not. More than one in ten rural households collect drinking water straight from rivers, ponds or streams, where contamination is a real risk.
Boreholes dominate, and piped water is rare
The most common single source is the tube well or borehole, used by 33.3% of households. It is the leading source in both urban (35.6%) and rural (30.8%) areas.
Piped water is uncommon. Only 7.8% of households have water piped into their dwelling, yard or plot. That is 11.7% in urban areas and 3.5% in rural areas. Public taps and standpipes serve 7.7% of households, and they are used slightly more in rural areas (8.4%) than in urban areas (7.0%).
Protected dug wells serve 12.2% of households, and they matter more in rural areas (13.4%) than in urban ones (11.2%).
Sachet water is an urban phenomenon
The sharpest urban-rural contrast among improved sources is sachet water, the small sealed bags sold across Nigeria. It is the main source for 24.4% of urban households but only 4.2% of rural households. Nationally it comes to 14.8%, which makes it the second most common single source after boreholes. Bottled water is much less common, at 1.1% of households overall. The survey counts both as improved sources.
Households with weak public water supply often buy water instead. Sachet water depends on a retail network and a household’s ability to pay, and both are stronger in cities. That is a likely reason for the urban-rural gap, though the table itself doesn’t say why.
What unimproved water looks like
Almost all unimproved use is the unprotected dug well: 11.4% of households overall and 21.2% of rural households, against 2.5% in urban areas. Unprotected springs add 1.2% overall. These sources are open to contamination from surface runoff, animals and handling.
How long it takes to get water
The second half of the table measures time. Overall, 47.8% of households have water on their premises (this includes water piped to a neighbour, and those reporting a round trip of zero minutes). Another 48.1% make a round trip of 30 minutes or less, and 4.0% spend more than 30 minutes.
The urban-rural pattern holds here too:
Water on premises: 59.3% of urban households and 35.2% of rural households.
30 minutes or less: 38.4% urban and 58.8% rural.
More than 30 minutes: 2.2% urban and 5.9% rural.
So rural households are much more likely to leave home to fetch water. They usually find it within half an hour, but nearly 6% face longer trips. Collecting water is often a daily task, and in many households it falls mainly on women and children.
One detail is worth noticing. Only 7.8% of households have water piped to their home, yet 47.8% have water on their premises. The difference is mostly households with their own borehole or well in the compound.
Key details
About 81% of Nigerian households use an improved water source, but the figure is 96% in urban areas and 66% in rural areas.
Boreholes are the backbone of the system, used by one household in three. Piped water reaches fewer than one in ten.
Sachet water has become a major source in cities and is far less common in rural areas.
Rural households are more likely to use unprotected wells or surface water, and to travel farther for water.
Closing the rural gap would mean protecting existing wells and extending borehole and piped supply, not only building new sources.
Source: Nigeria Malaria Indicator Survey 2025
Source of Drinking Water in Nigeria by Percent Distribution
Percent distribution of households and de jure population by source of drinking water and by time to obtain drinking water, according to residence
Nigerians with private jets: Names Names reportedly listed as Nigerians with private jets are: Aliko Dangote – Founder of Dangote Group Mike Adenuga – CEO…
Nigerians with private jets: Pictures Pictures of Nigerians that reportedly have private jets Bishop David Oyedepo Apostle Johnson Suleman Asiwaju Bola Ahmed Tinubu Atiku Abubakar…
Nigerians with private jets Some Nigerians, reportedly, with private jets are: Aliko Dangote – Founder of Dangote group Mike Adenuga – CEO of Globacom…
List of Nigerians who own private jets Some Nigerians who, reportedly, own private jets are: Aliko Dangote – Founder of Dangote group Mike Adenuga – CEO of…
Central Bank of Nigeria: Basic facts In 1991, the Bank s and Other Financial Institutions Act (BOFIA) formerly BOFI was promulgated to replace the CBN Act…
Bank of Burundi offices Headquarters 1, Avenue du Gouvernement B.P 705 BUJUMBURA Tel: (257) 22 20 40 00 / 22 22 27 44 Fax:…
Bank of Burundi address The address of Bank of Burundi Headquarters 1, Avenue du Gouvernement B.P 705 BUJUMBURA Tel: (257) 22 20 40 00…
Bank of Burundi history History of Burundi’s central bank, the Bank of the Republic of Burundi The Central Bank was created under the name…