Most to least populated of the 87 municipalities of the Department of La Paz
Top 10 Most Populated Municipalities of La Paz
The top 10 municipalities concentrate a very large share of the Department of La Paz’s population, reflecting strong urbanization and regional centralization.
1. El Alto (The High) – 885,825
Largest municipality in La Paz and one of the largest in Bolivia.
Major urban, commercial, and transport hub.
Characterized by rapid population growth driven by internal migration.
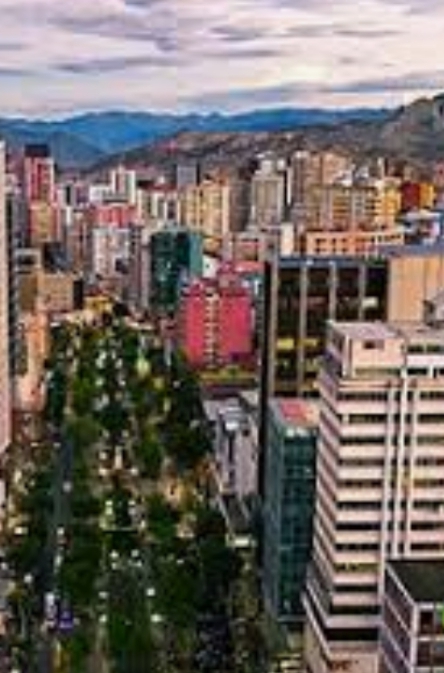
2. La Paz (Our Lady of Peace) – 757,431
Administrative capital of Bolivia.
Center of government, finance, education, and services.
Higher female population, linked to service-sector employment.
3. Viacha – 113,554
Key industrial municipality near the metropolitan core.
Strong links to manufacturing, logistics, and commuter populations.
4. Caranavi – 59,676
Important agricultural and commercial center in the Yungas.
Known for coffee production and trade.
5. Pucarani – 49,850
Strategic municipality on the Altiplano.
Combines agriculture, livestock, and transport connectivity.
6. Achacachi – 47,257
Traditional Aymara cultural and economic center.
Important regional market town near Lake Titicaca.
7. Achocalla – 46,188
Rapidly growing peri-urban municipality.
Increasing residential expansion from the metropolitan area.
8. The Assumption – 45,587
Medium-sized municipality with agricultural and local commerce activities.
Plays a key role in its surrounding rural area.
9. Peace – 38,652
Acts as a local service and administrative center.
Balanced mix of rural and semi-urban population.
10. Sicasica – 33,885
Important transport and trade node on regional routes.
Supports surrounding rural communities.
The top 2 municipalities alone (El Alto and La Paz) account for over half of the department’s population.
The top 10 reflect a clear contrast between dense urban centers and regional agricultural hubs.
Population concentration highlights economic opportunity, infrastructure, and migration patterns.
Municipalities of La Paz Ranked from Most to Least Populated
List of the 87 municipalities of the Department of La Paz, ordered from highest to lowest population
The High (El Alto) – 885,825
Our Lady of Peace (La Paz) – 757,431
Viacha – 113,554
Caranavi – 59,676
Pucarani – 49,850
Achacachi – 47,257
The Assumption – 45,587
Achocalla – 46,188
Peace – 38,652
Sicasica – 33,885
Sorata – 30,083
Palos Blancos – 27,137
Choroic – 27,711
Patacamaya – 25,148
Colquiri – 23,505
Coripata – 23,530
Irupana – 23,279
Mountains – 21,843
Finger – 21,729
Battles – 20,607
Mecapaca – 20,446
Apollo – 19,156
I inquired – 18,679
Cheer up – 18,303
Steel – 17,830
Mocomoco – 17,811
Copacabana – 17,463
Jesús de Machaca – 17,016
Port of Carabuco – 17,336
Sapahaki – 16,497
Guanay – 16,386
Charge – 15,763
Caquiaviri – 15,570
Cajuata – 15,565
Calamarca – 15,327
Puerto Acosta – 14,012
Tiahuanacu – 13,648
Cairoma – 13,598
Corocoro – 13,551
Theopont – 13,379
Colquencha – 12,490
Ixiamas – 12,595
Yaco – 12,296
Calacoto – 12,219
Come on, come on – 11,258
Quime – 10,887
Luribay – 10,703
High Beni – 10,585
Saint Bonaventure – 10,105
Tacacoma – 9,761
San Pedro de Curahuara – 9,217
Santiago de Huata – 9,287
Verse – 9,029
Pelechuco – 9,060
Umala – 9,102
San Pedro de Tiquina – 9,164
Ichoca – 9,552
Escoma – 8,837
Huarina – 8,679
Guaqui Port – 8,592
Santiago de Callapa – 8,037
San Andrés de Machaca (Marka) – 7,936
Villa Libertad Licoma – 7,877
Drain – 7,897
Puerto Pérez – 7,900
Deception – 7,716
Yanacachi – 7,615
Taraco – 7,540
Tito Yupanqui – 7,525
Cocamino – 7,226
Santiago de Machaca – 6,805
Pampa Paper – 6,649
Curve – 6,611
Waldo Ballivián – 6,442
Aucapata – 6,721
Humanata – 5,658
Necklace – 5,526
Catacora – 5,351
Mesh – 5,297
Comanche – 5,238
Huatajata – 5,118
Nazacara de Pacajes – 4,022
Quiabaya – 4,224
Charaña – 4,221
Combaya – 3,529
Chacarilla – 2,052
La Paz
More
List of La Paz Municipalities: 87 Municipalities of the Department of La Paz The Department of La Paz is administratively divided into 87 municipalities, listed below:…
List of Oruro Most Populated Municipalities List of municipalities and autonomous indigenous territories in the Department of Oruro, ordered from most populated to least populated Oruro…
La Paz Population by Municipality and Gender Population table for the Department of La Paz, structured by Municipality/TIOC, Total Population, Men, and Women Population by Department and…
List of Gaborone Most Populated Areas Gaborone areas list according to total population (highest to lowest), showing rank, area name and population. Gaborone Areas by Population…
Most Populated Departments of Bolivia The most populated departments of Bolivia, ranked from highest to lowest population Most Populated Departments of Bolivia are Santa Cruz…
Uganda Most Populated Districts The Top 30 Most Populated Districts of Uganda are as follows: RankDistrictRegionPopulation (2023 est.)1WakisoCentral3,519,3002Kampala (City)Central1,766,5003KaseseWestern843,9004YumbeNorthern775,0005MukonoCentral757,5006KakumiroWestern601,9007KyenjojoWestern584,4008LuweeroCentral558,1009AruaNorthern557,90010KyegegwaWestern551,90011BugiriEastern536,40012TororoEastern639,70013MbaleEastern639,70014MubendeCentral641,80015MayugeEastern615,20016KamuliEastern596,10017KagadiWestern474,70018BuyendeEastern468,40019IgangaEastern436,80020HoimaWestern413,10021SorotiEastern401,00022SerereEastern401,80023PallisaEastern399,50024MasakaCentral364,80025NtungamoWestern569,20026OyamNorthern491,60027IsingiroWestern658,10028KibaaleWestern234,80029ApacNorthern249,60030KabaleWestern256,900 Uganda Districts Population 1. General…
Most populated regions of Chad The 10 most populated regions of Chad are: N’Djamena (capital of Chad) Logone Oriental Mayo-Kebbi Est Ouaddaï Logone Occidental Tandjilé Mandoul…
List of Chad regions by population, from least to most populated Regions of Chad according to size of population, from least to most populated are: RegionPopulation (2023)Tibesti52,626Ennedi-Ouest109,753Borkou154,865Ennedi-Est175,321Bahr el Gazel407,256Salamat470,256Kanem505,839Lac509,258Sila591,300Batha748,395Wadi Fira792,394Guéra824,161Mayo-Kebbi Ouest858,593Hadjer-Lamis870,231Chari-Baguirmi884,924Moyen-Chari902,311Mandoul1,002,346Tandjilé1,007,812Logone…
Most populated provinces in Burundi The 10 most populated Burundi provinces are: Gitega Ngozi Muyinga Kirundo Kayanza Bujumbura Mairie Bujumbura Rural Cibitoke Karuzi Makamba List…
Most populated regions in Burkina Faso Burkina Faso 5 most populated regions are: Centre Hauts-Bassins Est Centre-Nord Boucle du Mouhoun List of regions by population, from…
Most populated Angola province The most populated province in Angola is Luanda with a population of 6,945,386. The 10 most populated provinces of Angola…
Most populated provinces of Angola The 10 most populated provinces of Angola are: Luanda Huíla Benguela Huambo Cuanza Sul Uíge Bié Cunene Malanje Lunda Norte…
Most populated provinces in Algeria The 10 most populated provinces in Algeria are: Algiers Oran Sétif Tizi Ouzou Batna Djelfa Blida Chlef M’Sila Tlemcen While…
5 most populated regions in Cameroon Cameroon’s 5 most populated regions are: Centre Far North Littoral North Northwest List of Cameroon regions by population. From largest…
10 most populated weredas in Tigray, Ethiopia The most populated weredas in Tigray, Ethiopia are: Semen Ahiferom Debub Hintalo Wajirat Were Lehe Saesi Tsadamba Raya Azebo Tselemti…
10 most populated weredas in Ethiopia The most populated weredas in Ethiopia are: Kolfe Keraniyo Hawassa Awubere Yeka Gonder Adama Bahir Dar Nefas Silk Bole Jijiga…
10 most populated Regions in Ethiopia The most populated Regions in Ethiopia are: Oromia Amhara SNNP (Southern Nations, Nationalities & Peoples) Somali Tigray Sidama South West…